Browse this page to learn more about MS Excel functions, charts, programming, and data analysis features.
Use the links below to go to the different sections:
Recommended Resources
Excel YouTube Channels
ExcelIsFun – by Excel MVP Mike Girvin. More than 2,000 Excel Videos
Mr. Excel – by Excel MVP Bill Jelen. Short excel video tutorials by Mr. Excel
Contextures – by Excel MVP Debra Dalgleish. More than 10,000 subscribers and several tutorials
ExcelTV – by Excel MVPs Rick Grantham, Jordan Goldmeier, and Szilvia Juhasz. Interviews with Excel experts, spreadsheet tips, contests, and panel discussions.
Excel Blogs
- Excel TV Blog: Blog posts for videos presented through Excel TV
- Excel Jet: Blog with lots of shortcuts, Excel formulas explanations, and more
- Excel Campus: Great blog run by Excel MVP Jon Acampora.
Data Visualization in Excel
E90E50 – Excel Charts Gallery: This website contains cool Excel Visualizations like the ones below
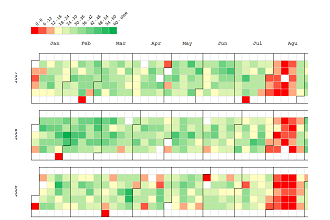 |
 |
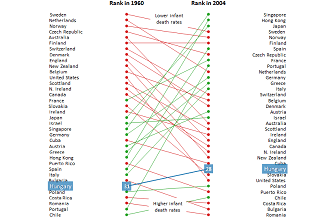 |
Peltier Tech: This website contains lots of tutorials to customize and create great Excel charts.
- Custom Visuals for Power BI: This site contains custom visualization to be used in Power BI.
Visual Basic for Applications (VBA) is the programming language that can be used to automate actions within Microsoft Office Applications such as MS Word, MS Power Point, MS Access, MS Excel, etc
This section contains several tutorials to show you how to automate tasks in Excel using VBA:
Beginner Level:
- I received a workbook with macros, how do I enable the macros? Link
- Essential VBA Terms: Link
- Understanding the Visual Basic Editor: Link
- Creating VBA Sub-procedures: Link
- Manipulating Cells in VBA: Link1 Link2
- Variables handling: Data types in VBA and Variable declaration
- Creating functions: Link
Intermediate Level:
- Understanding the VBA Object Model: Link
- Object Properties and Methods
- Manipulating Workbooks: Open workbooks, Saving workbooks
- Conditional Logic: If-then-else
- How do loops work on VBA: Link
Advanced Level
Specific Applications
- Formatting Dates in VBA: Link
- Working with Tables (Lists) in VBA: Link
- Working with Slicers in VBA: Link
- Improving VBA Performance: Link
- Using Regex in Excel VBA: Link (What’s RegEx?)
VBA References
- VBA cheatsheet: Link
Power BI is a set of tools that allow you to find, modify, visualize and share data. You can use these tools online by going www.PowerBI.com or you can use them in your computer by downloading Power BI desktop (Download Link).
See an example below of how you can create a dashboard within minutes in Power BI:
Power BI is composed by several tools with different purposes that can be downloaded independently such as Power Query and Power Pivot.
Power Query: Tool to extract, load, and transform data from different sources. Power Query can be installed as an Add-in for Excel 2010 and 2013. Fortunately, it is a built in feature in Excel 2016.
With PQ you can:
- Import data from multiple local and online data sources: Link
- Perform lots of data shaping operations: Link
- Share queries: Link
Power Query Blogs
Power Pivot: Tool to perform complex calculations over millions of rows of information. It also allows to create relationship between tables.
This video contains a brief description of the powerful capabilities of Power Pivot
This link contains several tutorials for you to get started with PowerPivot. In addition, it contains tutorials on how to work with the data model, relationships, hierarchies, DAX formulas, and much more.