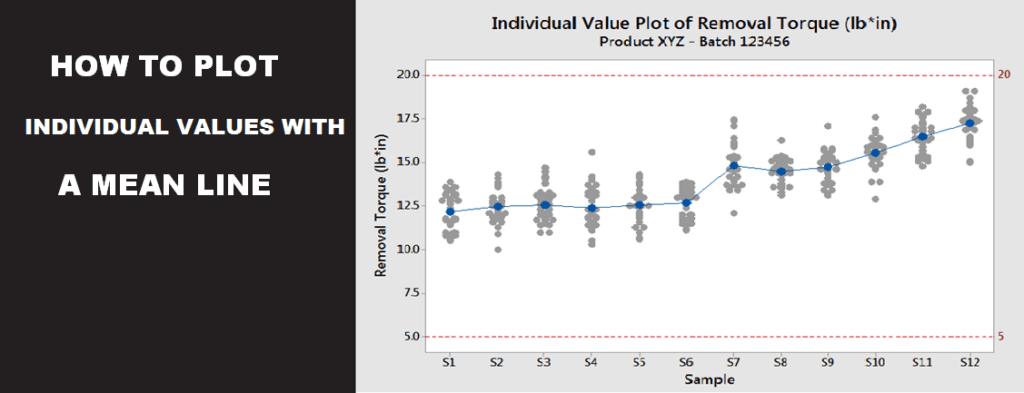
How to plot individual values with a mean line in Minitab

One of the most useful charts in Minitab is the Individual Values Plot since it allows you to see the distributions of the samples. You can also observe the general profile of the data if you add the mean values for each of the samples. To illustrate the use of individual value plots we will […]
Minitab Shortcuts Cheat Sheet

Ok, I admit it, I’m a shortcuts lover… As soon as I put my hands into a computer program I start looking for ways of doing things faster, and for me, keyboard shortcuts is one of the best ways of being faster at any program. Minitab is not the exception to this rule. That’s why […]
2 easy ways to import files from a folder into Minitab

Let me ask you a question: Let’s say you have 15 excel files (or .csv) in a folder. How do you import them into Minitab? Are you thinking in these steps? Go to File Open Worksheet Change the file type to Excel (or .csv or .txt) Browse for the file and click Open Repeat steps […]
Change the position of tick marks in the axes of a Minitab graph

Go to Master Data Analysis When you create a graph in Minitab with a lot of data points, Minitab will do its best to locate the tick marks in the axes in a readable way. However, you might want to change the position of tick marks in the axes to better suit your analysis. For […]
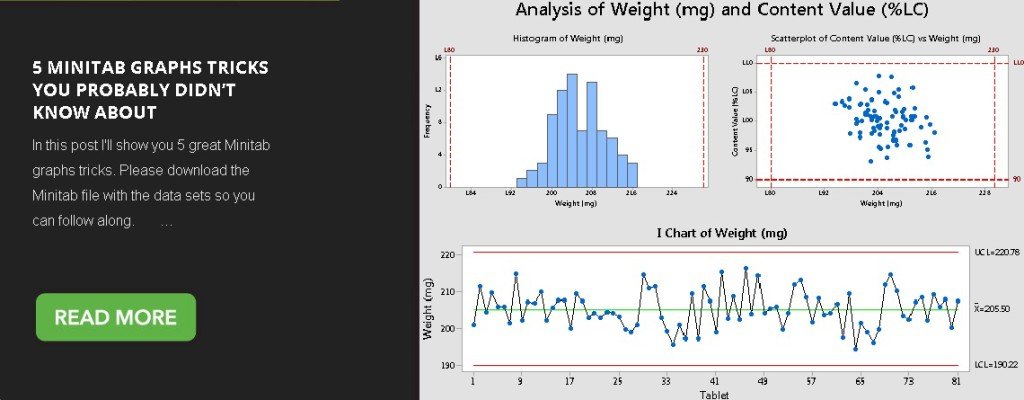
5 Minitab graphs tricks you probably didn’t know about

In this post I’ll show you 5 great Minitab graphs tricks. Please download the Minitab file with the data sets so you can follow along. Label specific points in graphs Don’t alternate ticks in graphs with panels Change layout of panels/graphs Include details as footnote for […]
Automatically export Minitab graphs to PowerPoint

Go to Master Data Analysis What do you do up after finishing an analysis with a lot of graphs in Minitab? Paste them one by one in PowerPoint or word, right? If you’re doing this, you’re wasting your precious time, because you can export all your graphs and analysis with a single command within Minitab. […]